Dynamic format strings is available in Calculation groups, offering a convenient way to customize the formatting of measures based on specific conditions. However, this approach had certain limitations and issues that users encountered.
Initially, Calculation groups allowed users to define different calculation scenarios and apply dynamic format strings to measures within those scenarios. This functionality was particularly useful when dealing with complex business rules that required different aggregations or calculations based on specific criteria.
However, several problems arose when utilizing dynamic format strings within Calculation groups:
Compatibility Issues: Dynamic format strings in Calculation groups were not fully supported across all Power BI client tools and versions. Users experienced inconsistencies when viewing reports or dashboards in different environments, leading to formatting discrepancies and loss of intended visualizations.
Performance Impact: Applying dynamic format strings in Calculation groups could significantly impact query performance, especially in scenarios where multiple calculation scenarios and complex formatting rules were involved. This could lead to increased memory consumption on queries that leads to slower report rendering and decreased user experience.
Maintenance Challenges: Managing and maintaining Calculation groups with dynamic format strings proved to be challenging. As the number of calculation scenarios and formatting rules increased, it became more difficult to ensure consistency and keep track of the various formats being applied. This resulted in higher maintenance efforts and increased complexity in report development. Also it requires an external tool (Tabular Editor) in order to update this format strings.
Dynamic format strings for measures are currently in Preview but already allow users to dynamically change the formatting of data visualizations based on certain conditions or user interactions. It provides flexibility and enhances the interactivity of reports and dashboards, enabling users to customize the appearance of their data dynamically.
With dynamic format strings, you can modify various aspects of visualizations, such as numbers, dates, and colors, based on specific rules or user-defined parameters. This feature is particularly useful when you want to highlight specific data points or emphasize certain trends in your data.
Here are a few examples of how dynamic format strings can be utilized in Power BI:
Conditional Formatting: You can apply different formats to values based on predefined conditions. For instance, you can define a rule that highlights sales figures in red if they fall below a certain threshold or changes the background color of a cell based on its value range.
Interactive Formatting: Dynamic format strings can be linked to slicers or other visual elements on your report, allowing users to change the formatting on the fly. For example, you can provide a dropdown menu that lets users select a currency symbol for displaying financial data, or dynamically switch between different date formats based on user preferences.
Advanced Visual Effects: Dynamic format strings enable you to create sophisticated visual effects by combining formatting options with measures and calculations. You can create gauges, data bars, or heat maps that dynamically change their appearance based on the underlying data values.
Implementing dynamic format strings in Power BI involves using DAX (Data Analysis Expressions) expressions and conditional logic. By leveraging DAX, you can define rules and conditions that determine the format of your data visuals. These expressions can be written directly within the formatting options of each visual or stored as separate measures in the model.
Here are some examples:
Currency format based on Country.
We have a table with Country-Region and Value Sales, a simple SUM measure.
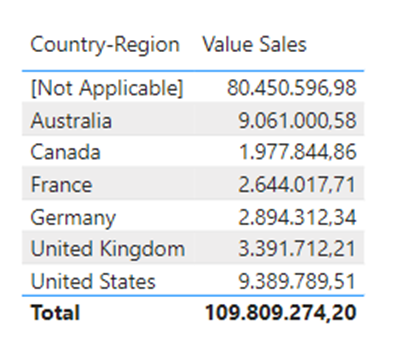
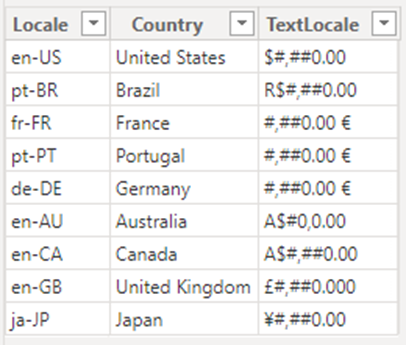
Now we need to create a table with our new format options based on the country.
Locale =
DATATABLE (
    "Locale", STRING,
    "Country", STRING,
    "TextLocale", STRING,
    {
        { "en-US", "United States", "$#,##0.00"},
        { "pt-BR", "Brazil", "R$#,##0.00"},
        { "fr-FR", "France", "#,##0.00 €"},
        { "pt-PT", "Portugal","#,##0.00 €"},
        { "de-DE", "Germany", "#,##0.00 €"},
        { "en-AU", "Australia", "A$#0,0.00"},
        { "en-CA", "Canada", "A$#,##0.00"},
        { "en-GB", "United Kingdom", "£#,##0.000"},
        { "ja-JP", "Japan", "¥#,##0.00"}
    }
)
It will generate the following table:
Then we create a new measure based on the [Value Sales] like this Value Sales (Format String) = [Value Sales]
In this new measure change the format to Dynamic.
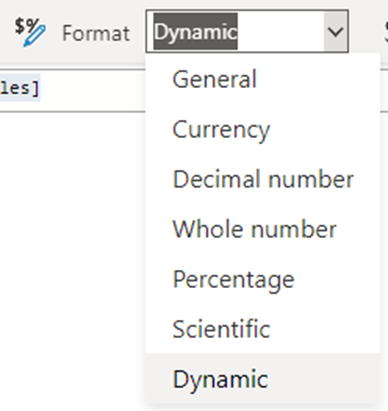
A new option will appear at the left of the measure input area. Choose Format.

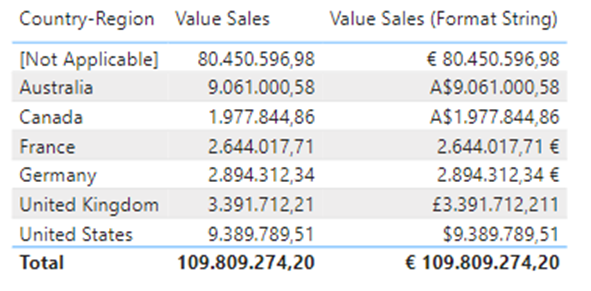
In this new Format pane, write the following DAX code:
COALESCE(
LOOKUPVALUE(Locale[TextLocale],Locale[Country],SELECTEDVALUE(Customer[Country-Region])),
"€ #,##0.00")
Now if we put this new measure [Value Sales (Format String)] onto the table.
But we can make this type of formatting without needing to specify the format for each currency manually.
Creating a measure Value Sales (Format Locale String) = [Value Sales] and in the Format area write the following:
VAR _value = COALESCE(
                   LOOKUPVALUE(Locale[Locale],Locale[Country],SELECTEDVALUE(Customer[Country-Region])),
                   "pt-PT")
RETURN
"""" & FORMAT(SELECTEDMEASURE(), "Currency",_value) & """"
The result is similar but based on the Format option with the Currency setting.

We can make the formatting a little more interactive for the user, for example, the user can choose how it wants to see the data.
Create a Format Parameter table, with the following code:
Format Parameter =
DATATABLE (
    "Select", STRING,
    "Format String for $", STRING,
    {
        { "in K (1,000s)", "#,##0,.0 K" },
        { "in M (1,000s)", "#,,.0 M" },
        { "💲", "#,##0💲" },
        { "Full", "#,##0" },
        { "Full with decimals", "#,##0.00" }
    }
)
Then in a measure Dynamic Format Sales = [Value Sales], in the Format pane paste the following code:
SELECTEDVALUE('Format Parameter'[Format String for $],"#,#00.0")Create a slicer with the Select column from the Format Parameter table, and now the user can interact with the formatting.
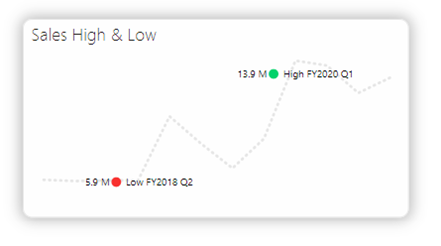
For the last example, a simple and stylish approach to give information.
Once again, create a measure Values Sales (High Low) = [Value Sales] and in the Format Pane paste the following code.
VAR _current = SELECTEDMEASURE()

VAR _tbl =
CALCULATETABLE(
    ADDCOLUMNS(
        SUMMARIZE(Sales,'Date'[Fiscal Quarter]),
        "value",SELECTEDMEASURE()),
        ALLSELECTED()
)
VAR _max = MAXX(
                _tbl,
                SELECTEDMEASURE()
        )

VAR _min = MINX(
                _tbl,
                SELECTEDMEASURE()
        )
RETURN
//""""&_max & " - " & _min & " - " & _current & """"
SWITCH(
    TRUE(),
    _max = _current, """" & FORMAT(_current, "#,,.0 M") & "🟢 High " & SELECTEDVALUE('Date'[Fiscal Quarter])  & """",
    _min = _current, """" & FORMAT(_current, "#,,.0 M") & "🔴 Low " & SELECTEDVALUE('Date'[Fiscal Quarter]) & """",
    " ")
Now with some visual tweaking we get this type of visual.
It’s worth noting that dynamic format strings provide a powerful way to enhance the user experience and improve data comprehension in Power BI. By applying formatting rules that adapt to the context or user interaction, you can create more engaging and intuitive reports and dashboards.
Sources:
Create dynamic format strings for measures in Power BI Desktop – Power BI | Microsoft Learn


0 Comments