Introduction
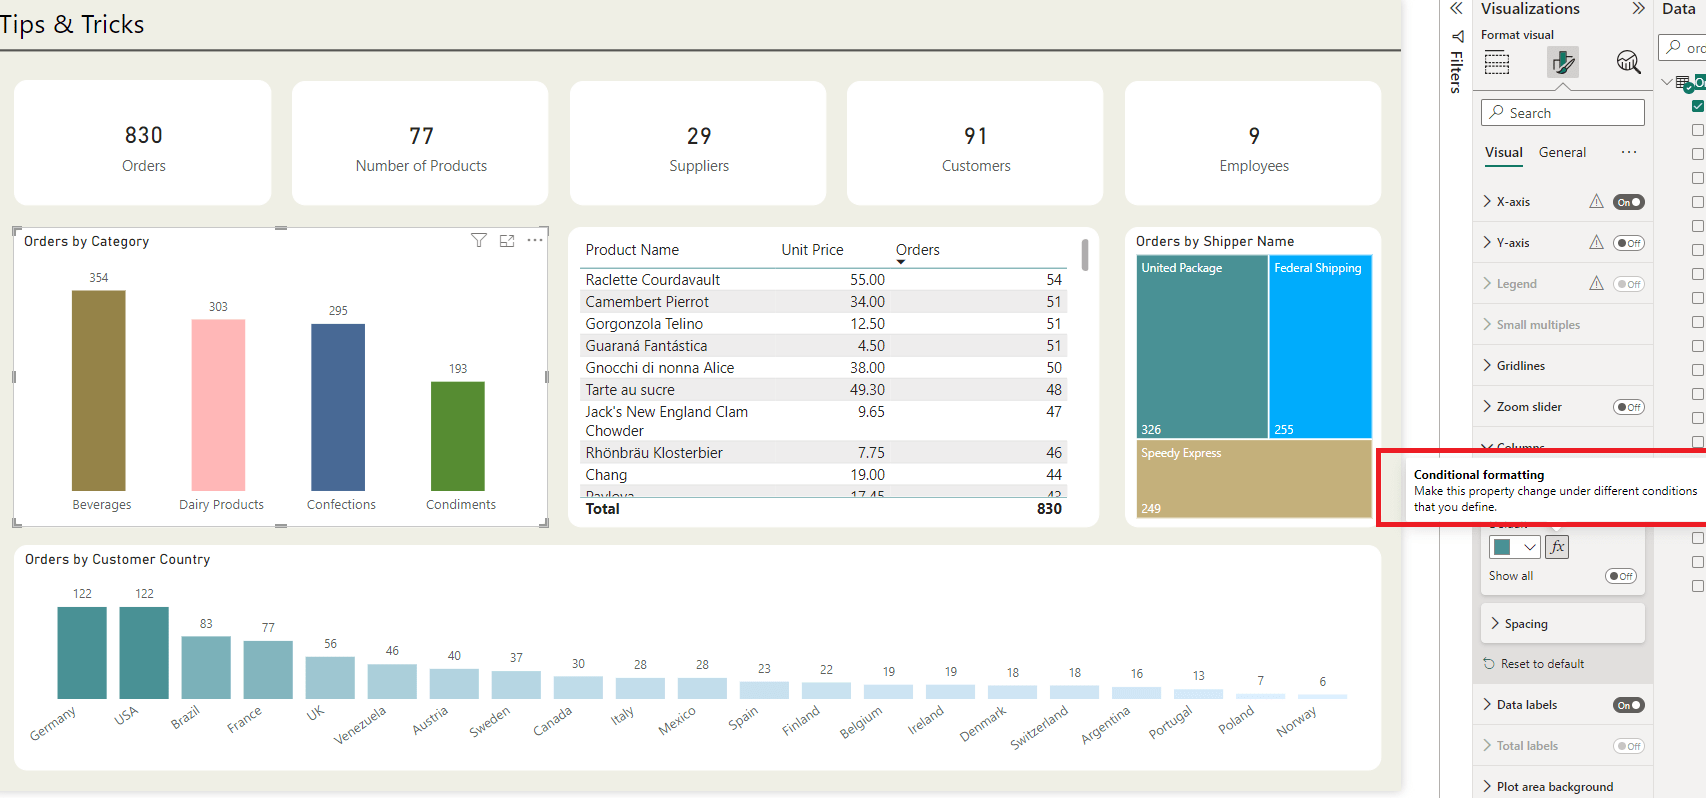
Conditional formatting is a Power BI feature used to change the color of values on visuals based on conditions or rules. This makes it easier to highlight important information and improves the overall readability of our reports.
We can apply conditional formatting through three different options: Rules, Gradient or Field Value.
The goal
In this post I’m going to explain how to apply conditional formatting over text fields in Power BI using a DAX measure.
Let me give you a pratical example:
Suppose we have a visual that shows us the number of Orders by Category, and we want to apply a different color for each of the following categories:
First, before trying to apply conditional formatting, we also have the option to manually specify the colors for each of the categories.
However, this is not the best option because it would be too much work to define the colors for each of the categories, and whenever we have new values, we would need to adjust it again. Additionally, it is important to keep color consistency on the different pages of our report, so imagine the time we would spend to apply the same conditional formatting to all of our visuals!
The question is: How can we apply conditional formatting over text fields in a practical and easy way?
The solution
The overall process is:
- Create a measure to determine which color should be used:
- The color can be defined through words, such as green, red, blue, (…), or through hex codes, like #FFB7B7, #486995, (…).
- Once you’ve chosen the colors you want to apply, the next step is to set up the conditional formatting so that the color is determined by the measure.
Here is the step-by-step process explained:
- To start, you need to choose the colors you want to apply on your visuals. If you prefer to use hex codes instead of words, you can find them easily using the standard pop-up on Power BI. You just need to choose a color and then copy the code.
Look at this example:
_Color =
VAR selected_category =
SELECTEDVALUE ( Category[CategoryName] )
RETURN
SWITCH (
selected_category,
"Beverages", "#958348",
"Dairy Products", "#FFB7B7",
"Confections", "#486995",
"Condiments", "#568C32"
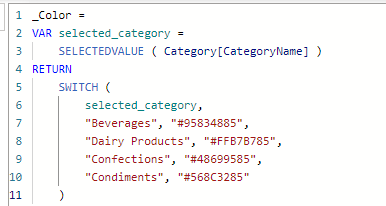
)The logic is as follows:
- We create a variable named selected_category that will check what the Category that is selected and will retrieve that text value.
- Then we do some conditions and apply the colors according to the condition which gives the result true.
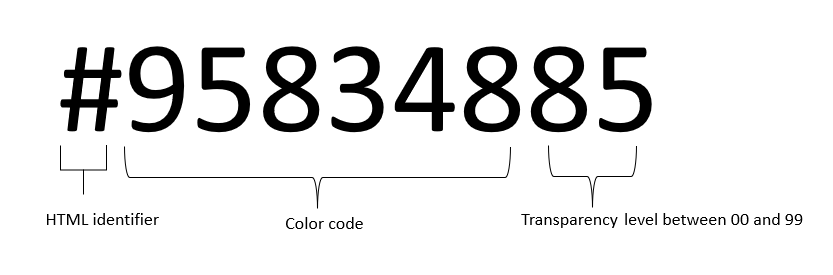
Additional tip – Color transparency
Whenever we use hex codes on our measure, we can also create varying levels of transparency for the colors!
To do that, we just need to add two digits in the end of the hex code and manipulate the level of transparency. We can define values between 00 and 99, where 00 represents a transparency level of 100% and 99 represents a transparency level of 1%.
Something like this:
For example, by choosing a transparency level of 85, our measure will look like this.
Finally, the last step is to apply the conditional formatting on the visual so that uses our measure.
The result is as follows. All visuals in the report that use this measure will be updated automatically!
Final Considerations
This method is easy to apply and very useful since we can easily update the measure later by:
- Adding extra conditions
- Using different colors with different levels of transparency to highlight the most important information.
Additionally, we can keep consistency across the different visuals on report whenever we want to use conditional formatting applying the same colors!


0 Comments