Questions:
- Are you a frequent user of Microsoft Excel?
- Have you ever wished that Microsoft Excel could deal with more data?
- Do you struggle with daily repetitive tasks that could be automatized?
- Do you want to stand out with dynamic reports that take your audience´s breath away?

If your answer is “Yes” to at least one of the questions above, allow us to talk to you a little bit about the best upgrade you can make to Excel: its youngest son, Microsoft Power BI.
There is a lot of advanced content, but what about the majority of us that want to start? DevScope has the answer for you: Welcome to the blog article series “#goingbacktobasics“.
Introduction
So, why so much buzz about Power BI? Is there something really special or is it just another hype that soon will pass?
There is indeed something truly special about Power BI, which is the reason why Gartner keeps awarding it, year after year, as the ultimate Leader for analytics and business intelligence platforms.
This means that Power BI:
– Shows both the highest ability to execute and the right completeness of vision ;
– Empowers individuals, teams, and organizations to perform better, optimizes collaborative work and easy access to data… all that while being user-friendly and powerful.
Right now, you are probably thinking:
– “Right, it’s all fun and games in theory, but I probably need to know how to code and such a powerful tool must be expensive…”.
Good news, the answer is: “No, you don’t and no, it isn’t”.
What is Power BI?
Power BI is not just a program or app, but a “collection of software services, apps, and connectors that work together to turn your unrelated sources of data into coherent, visually immersive, and interactive insights. Your data may be an Excel spreadsheet or a collection of cloud-based and on-premises hybrid data warehouses. Power BI lets you easily connect to your data sources, visualize and discover what’s important, and share that with anyone or everyone you want” – “What is Power BI? – Power BI | Microsoft Learn”.
What about the price? Power BI has several plans (there are and really democratizes its usage). There is a free version that allows you to create a model with your data, create your own datasets, tests, reports, etc. Yes, of course, paid plans do have more features, but still, is there anything better than this?
Excel vs. Power BI
So you work daily with Excel and you are probably wondering: I already have the power of quick calculations, multifunctionality, and sophisticated tables… how could Power BI help me any further?
Well, Excel is an amazing calculation tool (and sometimes is even used as a “database”), but Power BI will get you to the next level with:
- Performance: Power BI can take a LOT of data without even blinking. Forget about the maximum of 500 MB per file and a maximum of ~1.000.000 rows. Power BI is ready for big data and the Vertipaq engine is ready to compress it in a breeze;
- Automation: Besides creating simple rules such as filters based on expressions, lists, replaces, conditional columns, etc, you can create more advanced rules, such as, for example:
- Every time a new file is added to a folder its content will be appended to an existing table where the old ones are stored;
- Every time new data is added, it is automatically unpivoted;
- Automatically delete new columns that don’t belong to the expected scope;
- Periodically scans the sources and refreshes data automatically, several times a day.
- Powerful calculations: Power BI allows you to make several kinds of powerful calculations, along different tables and contexts, both using DAX or quick measures describing the calculation you need with natural language ;
- Connectivity: Power BI is capable of gathering large sets of data from several sources, and gathering them all in just one place, a dataset;
- Collaborative work: Several people can create reports and analyze data at the same time, make notes, create alerts, etc;
- Rich, attractive, and interactive reports: Forget about the pre-designed templates and layout on Excel. Power BI allows you to customize your reports, KPIs, and visuals to an impressive level of detail, with low to no code needed. Power BI allows you to create a story around your data and communicate it in an impactful way;
- An amazing sense of community, in which partners, end-users, BI developers, and even a Microsoft team of product developers come together to share knowledge and help each other to grow and become better and better.
Starting with Power BI
You are probably wondering: Ok, I want to give it a try, but how do I do it?
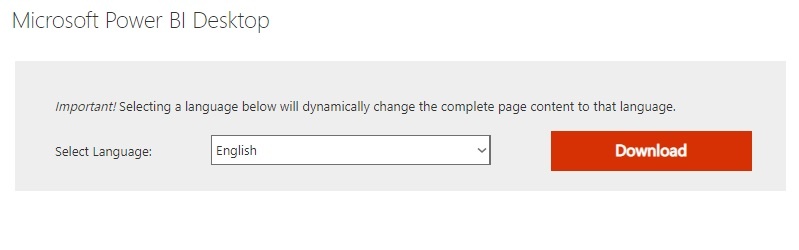
1- Go to https://www.microsoft.com/en-us/download/details.aspx?id=58494
2- Choose the language of your preference (if possible, go for English) -> Download.
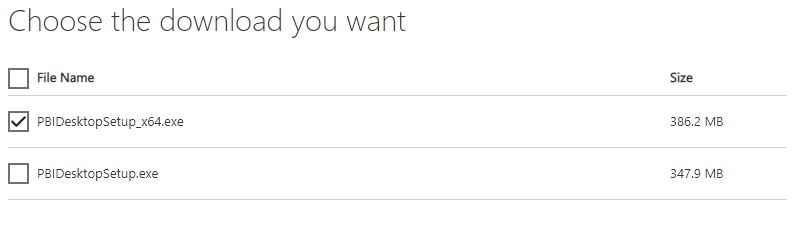
3- Choose the version to download (preferably x64) -> Next:
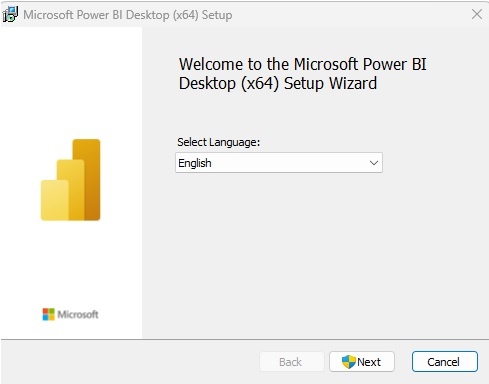
4- Execute the .exe file and follow the installation steps as needed:
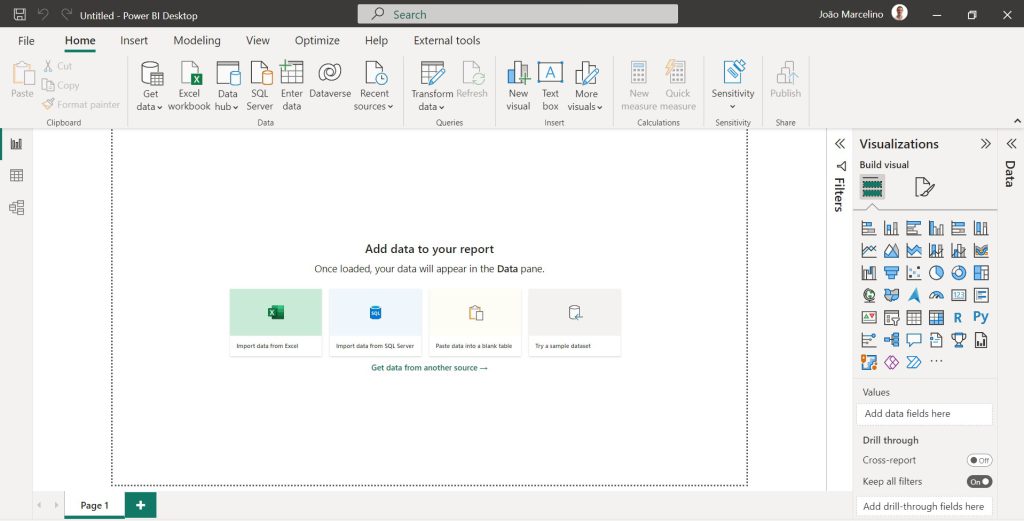
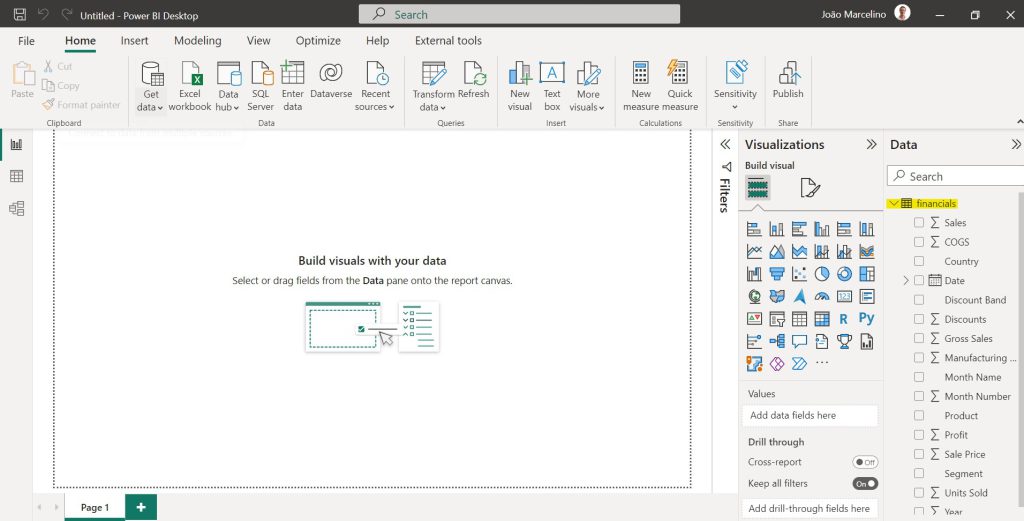
5- After installation, open Power BI -> Close the pop-up window and check the main page – your report canvas:
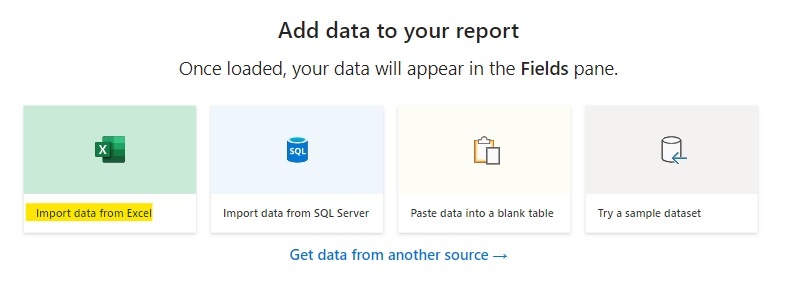
6- There are several ways to start importing data to Power BI. The easiest one is:
6.1- Click -> Import data from Excel:
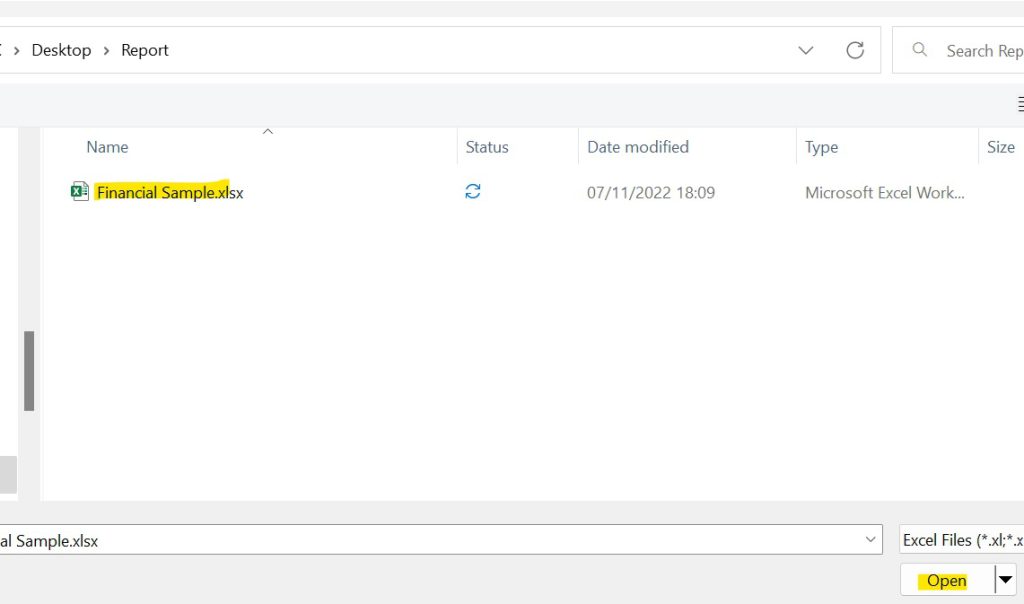
6.2- Browse for the chosen Excel file: Go to the folder in which you have your Excel file stored -> Click “Open”
(If you don’t have any sample file, you can download a “Financial Sample” for free here)
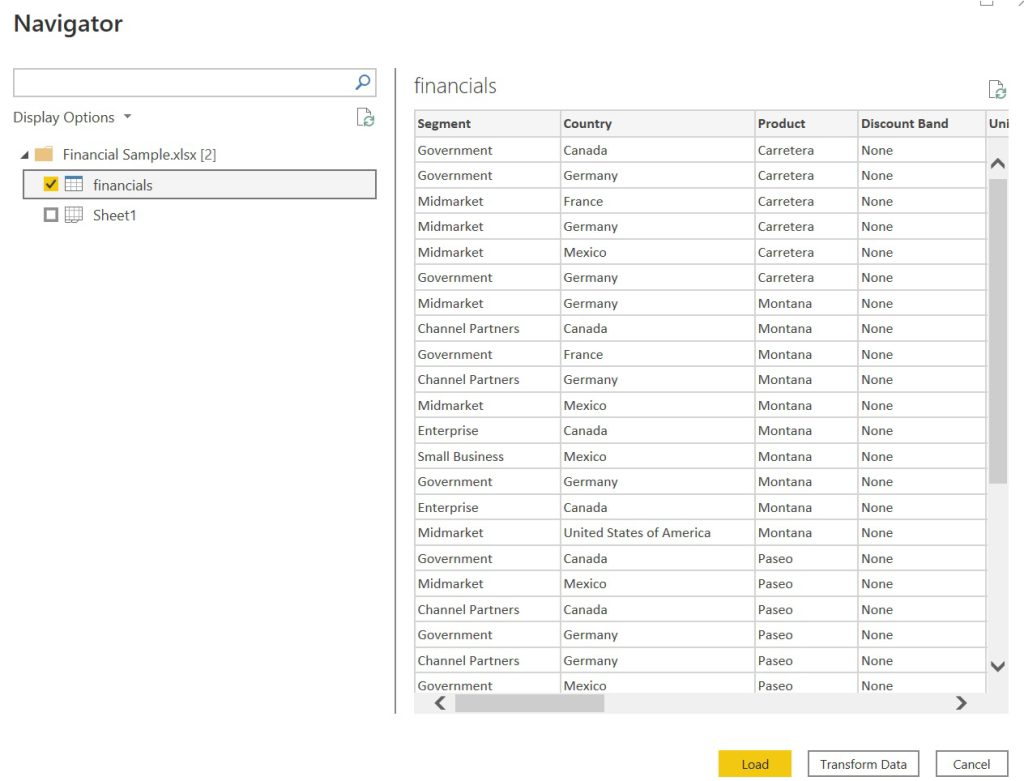
6.2- A navigator pops up and you can choose which object to open, either a table (financials) or a whole sheet (sheet 1). Choose “Load” if you want to directly import the table or “Transform Data” if you want to transform your data (change column names or delete columns for example).
For now ->Click Load:
7- Under Data -> Click on the drop-down under the name of your table (“financials”) to check every column/field there is:
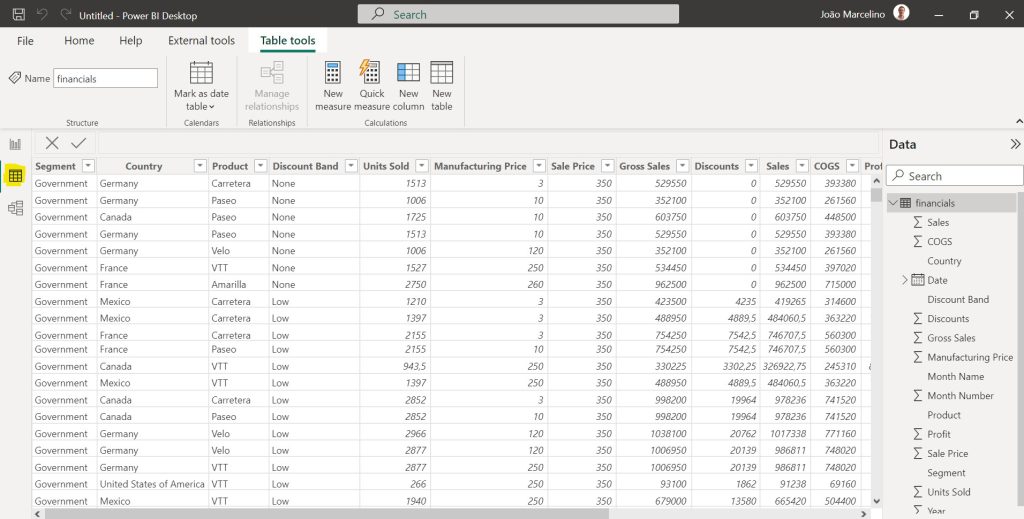
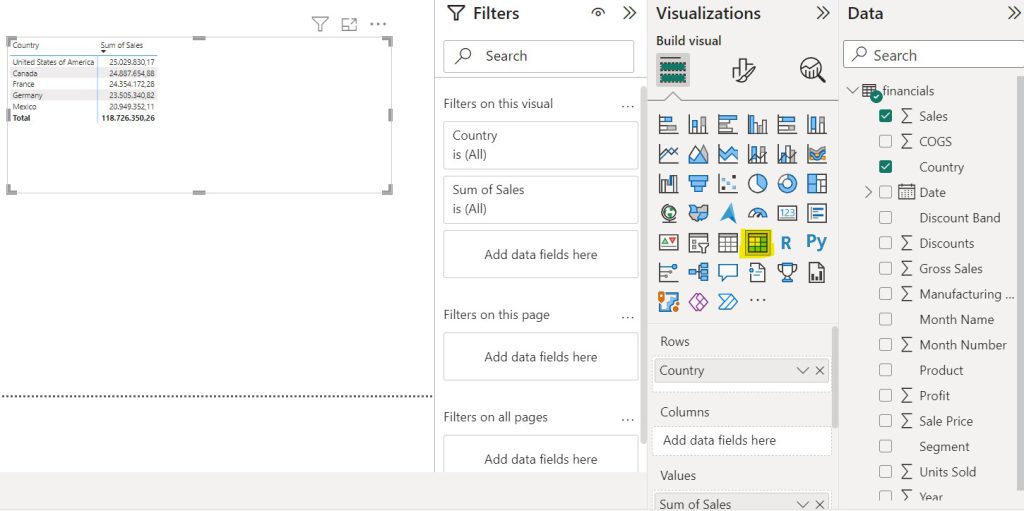
8- Also, you might want to check the table’s content, by clicking on the table symbol (yellow):
Here, you can analyze and filter your table as if you were in Excel. Keep in mind that, unlike Excel, this doesn’t change the number of rows in your dataset and visuals.
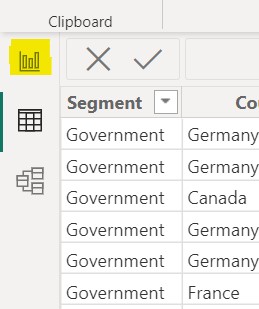
9- To go back to report building and visual analysis, click on the chart symbol (yellow):
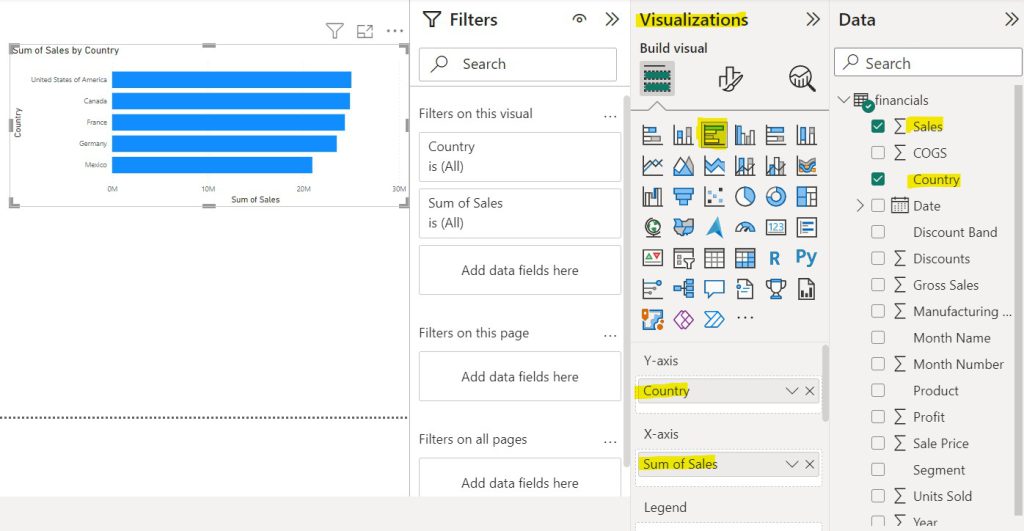
10- Under Visualizations
10.1- Choose a visual, for example, Clustered bar chart
10.2- Drag and drop the wanted fields, for example, to the y-axis (“Country”) and to the X-axis (“Sales”)
10.3- Watch the magic happen 🙂
11- Play with your visuals
11.1- Drag and drop your visual to where ever you want
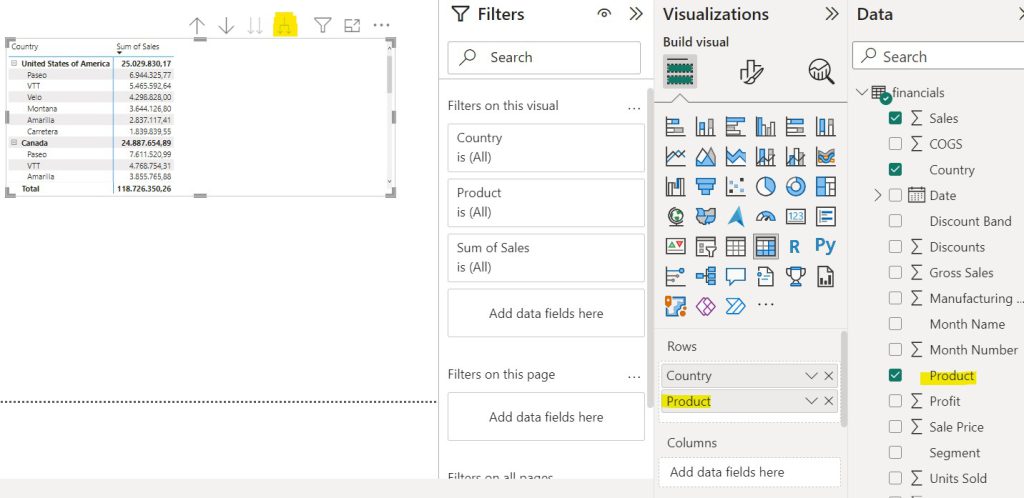
11.2- Turn your bar chart into a pivot table (aka Matrix) by clicking on your bar chart and selecting Matrix (yellow)
11.3- Add more fields to your table rows (for example Product) and expand the fields:
Conclusion
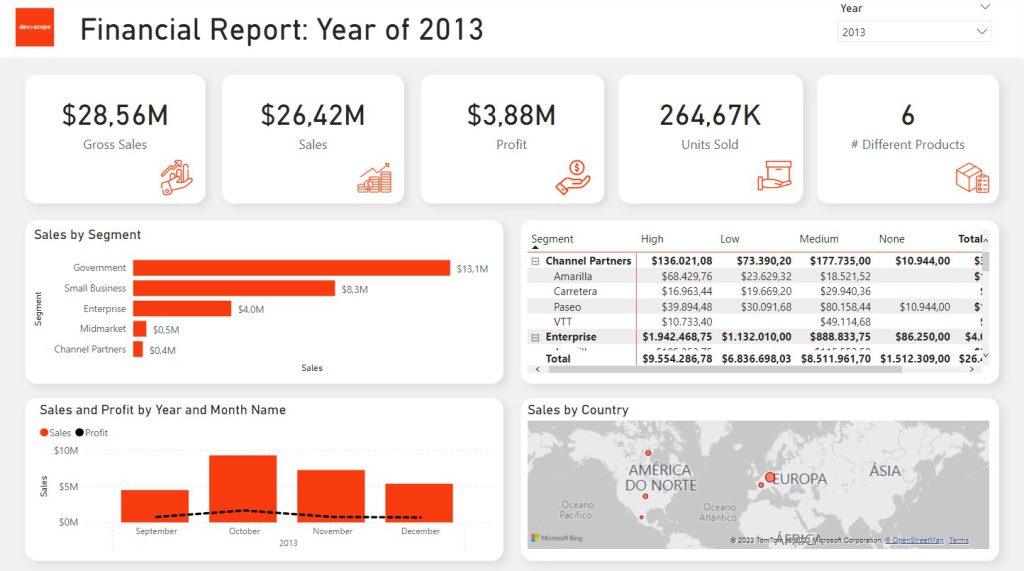
This is just a small, yet complete, example of how to migrate data from Excel to Power BI and take it to the next level. This article is introductory and aims to show how Power BI can be easily started and how to upgrade the usability of your Excel files. Power BI is Excel’s best friend and will soon become yours too 🙂
The next parts will take you a step beyond functionalities and best practices!
If you want to try it out by yourself with a Financial Excel Sample from Microsoft, you can get it here.
In the second part of this article, we will explore examples of actions that you might have a hard time performing in Excel and that you will easily achieve in Power BI.

We hope you enjoyed it and don’t miss “part 2/3” of this article.
May the Power B(I) with you!
PS>cope:
If you want to know more about our services and how we can help grow your business, click here to learn more about us. Also, don’t miss the many tips for Power BI and other tools we regularly share on our YouTube channel.
Finally, stay tuned for DevScope’s free events, such as “Dashboard in a Day”, to further expand your knowledge and experience with Power BI.


0 Comments